Know exactly who your customers are.

Recency, frequency, money — every customer sorted nightly into seven segments with real economics attached, and plotted on the map that drives your targeting.

🧠 7 RFM segments, nightly
💰 At-risk revenue in dollars
🗺 Geocoded customer map
The customer brain

17,881 customers, sorted into who they really are.

Every customer's purchase history rolls into RFM segmentation — recency, frequency, money — refreshed nightly into seven segments: Champions, Loyal, Potential, At Risk, Lost, and more.

The numbers carry real weight: our Champions segment is 3,279 customers averaging $1,817 in spend at 25.2× visit frequency — and the At-Risk banner puts a dollar figure ($565,341) on the revenue that's drifting away.

  • Seven RFM segments, refreshed nightly
  • Per-segment spend, frequency, inactivity, and loyalty membership
  • At-risk revenue quantified — the argument for the win-back campaign
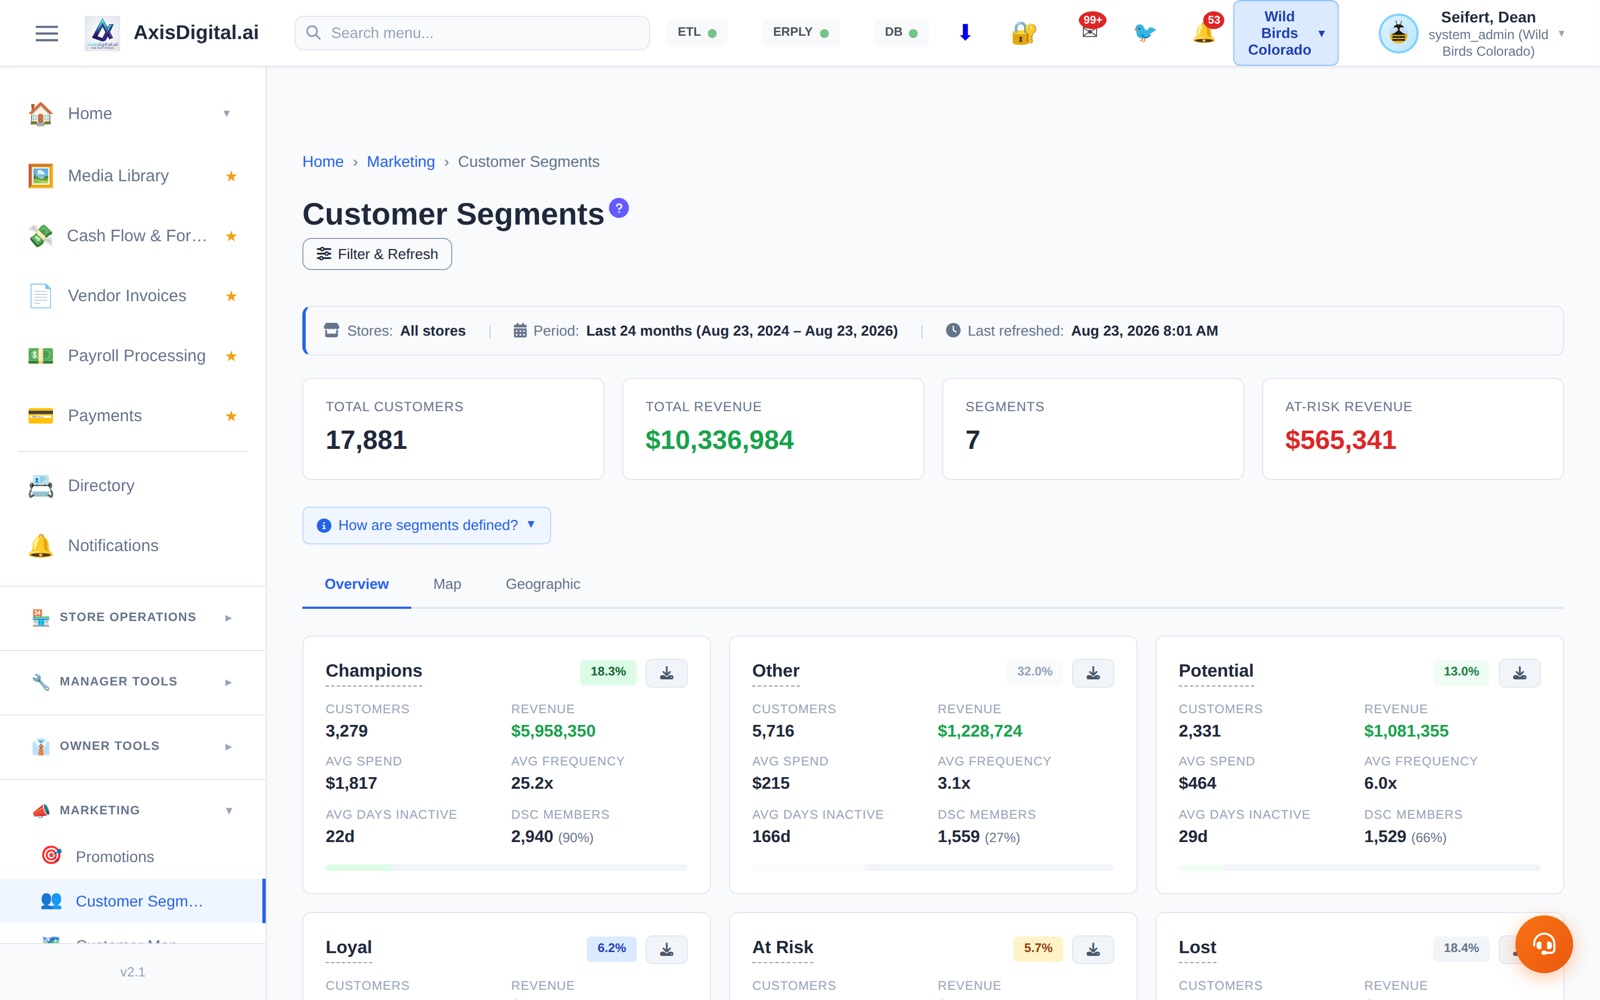
17,881 customers, sorted into who they really are.
Real segmentation: 17,881 customers, $10.3M revenue, at-risk dollars on screen.
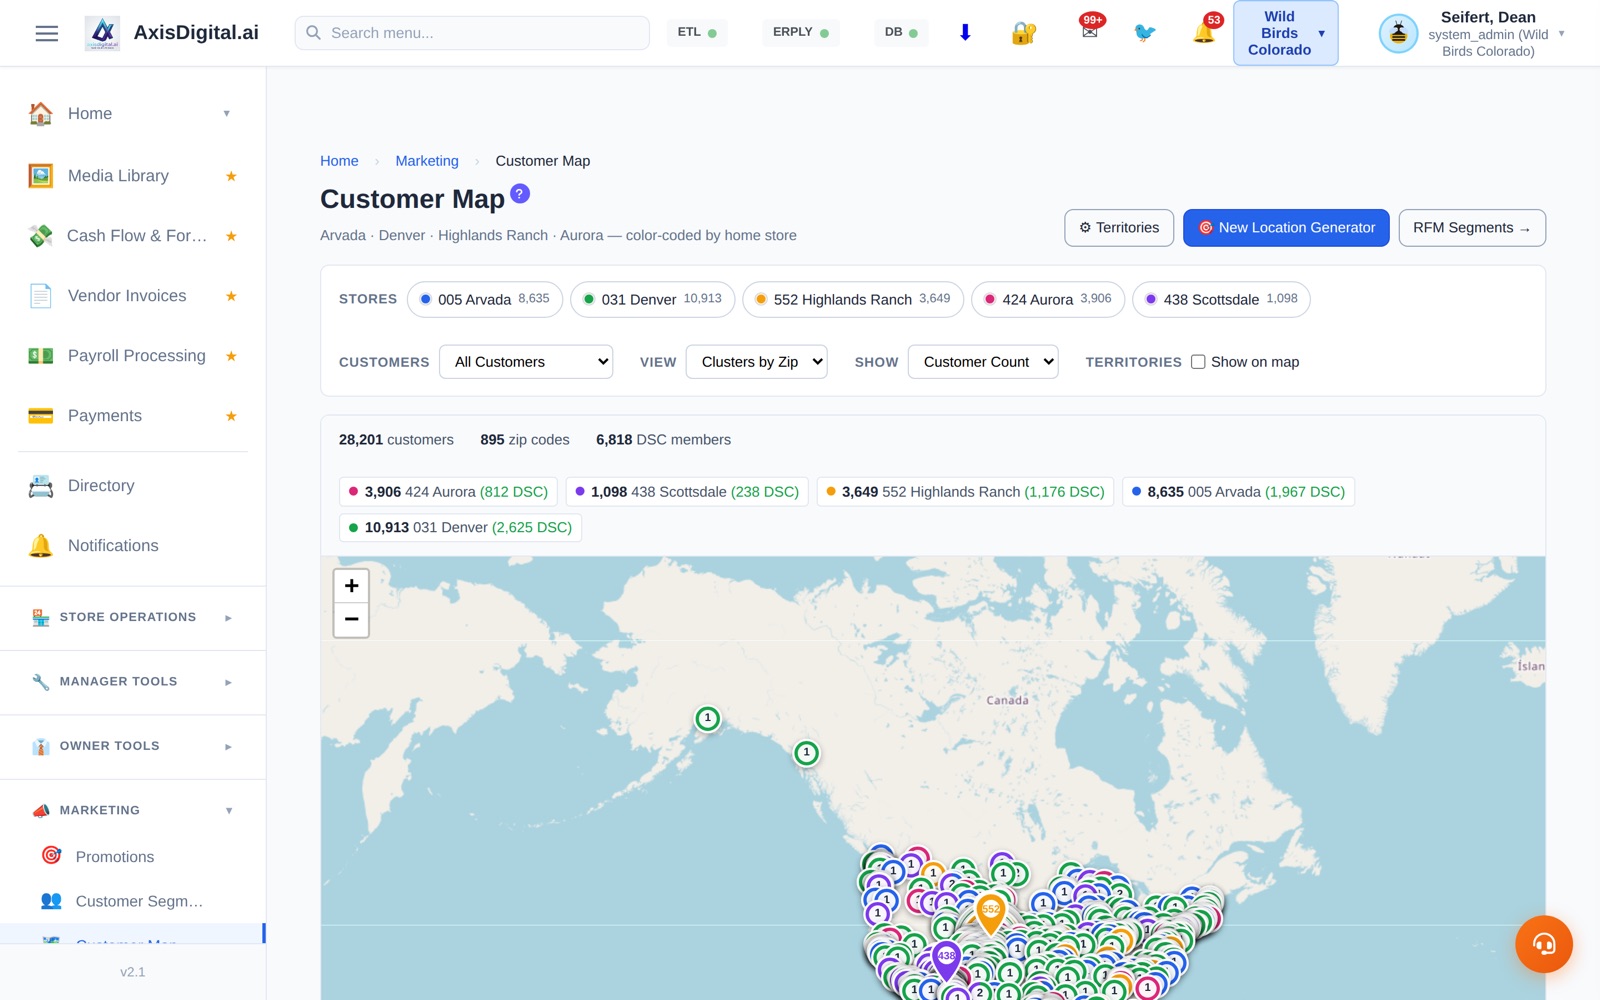
On the map

See where your customers actually live.

Every customer is geocoded and plotted. The map answers the questions a spreadsheet can't: where your gravity actually reaches, which neighborhoods punch above their weight, and where a competitor's opening would hurt.

It's also the engine behind EDDM route scoring — mail routes are ranked by how many of these dots they contain.

  • Full customer base geocoded and mapped
  • Filter by segment — map only your Champions, or only At Risk
  • Feeds EDDM route scoring and trade-area analysis
See where your customers actually live.
The customer base as geography — the input to every targeting decision.
⚡ Marketing Suite Power-Up

Part of the Marketing Suite.

Included in the Marketing Suite power-up at $99/store/month, added to any Axis Platform subscription.

See it in action →

Find the money hiding in your customer list.

See your own base segmented — the at-risk number alone is worth the look.

📅 Book a Demo →

Book a Demo

See the Analytics Dashboards in action — 30 minute walkthrough

March 2026

📅
Plan
Date
Time
Duration30 minutes

You're All Set!

Your demo is booked for

We'll send a calendar invite and Zoom link to

Get in Touch

Have a question about Analytics & Performance? We'll get back to you within one business day.