Plan the year. Publish the goals.

Full-year scenarios you compare and promote, targets that become a live scoreboard, and payout math every employee can see.

📊 Full-year scenario modeling
🎯 Self-computing attainment
💵 Per-employee payout tracking
The scenario workbench

Model the whole year before it starts.

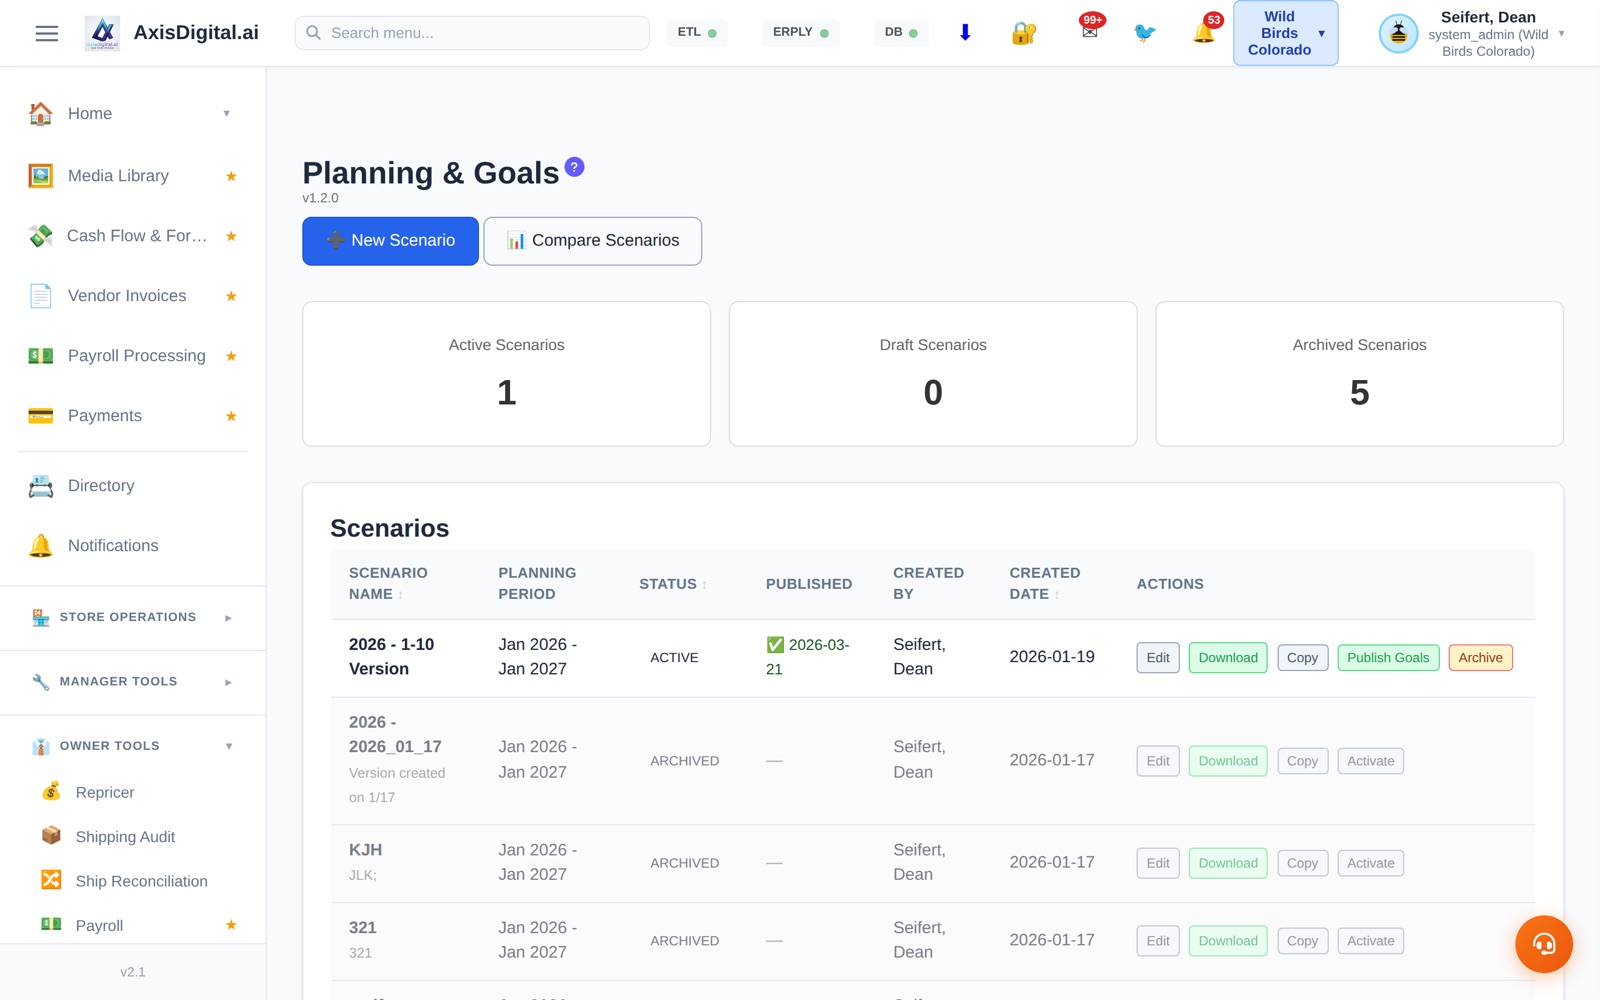
Sales, labor, and margin planning happens in scenarios — full-year models you build, copy, and compare side by side. Keep one active, park the rest: a real workbench here holds one active plan and five archived versions of the same year, each downloadable and revivable.

Tweak assumptions in a copy, compare it against the current plan, and promote it when it wins. The plan of record is always explicit — never a spreadsheet named final-v7.

  • Full-year scenarios per store — copy, compare, archive, activate
  • Download any scenario for offline review
  • One-click Publish Goals turns the plan into live targets
Model the whole year before it starts.
The scenario table: one active plan, five archived versions, publish from the winner.
Published goals become a scoreboard

Attainment tracks itself — and prices the payout.

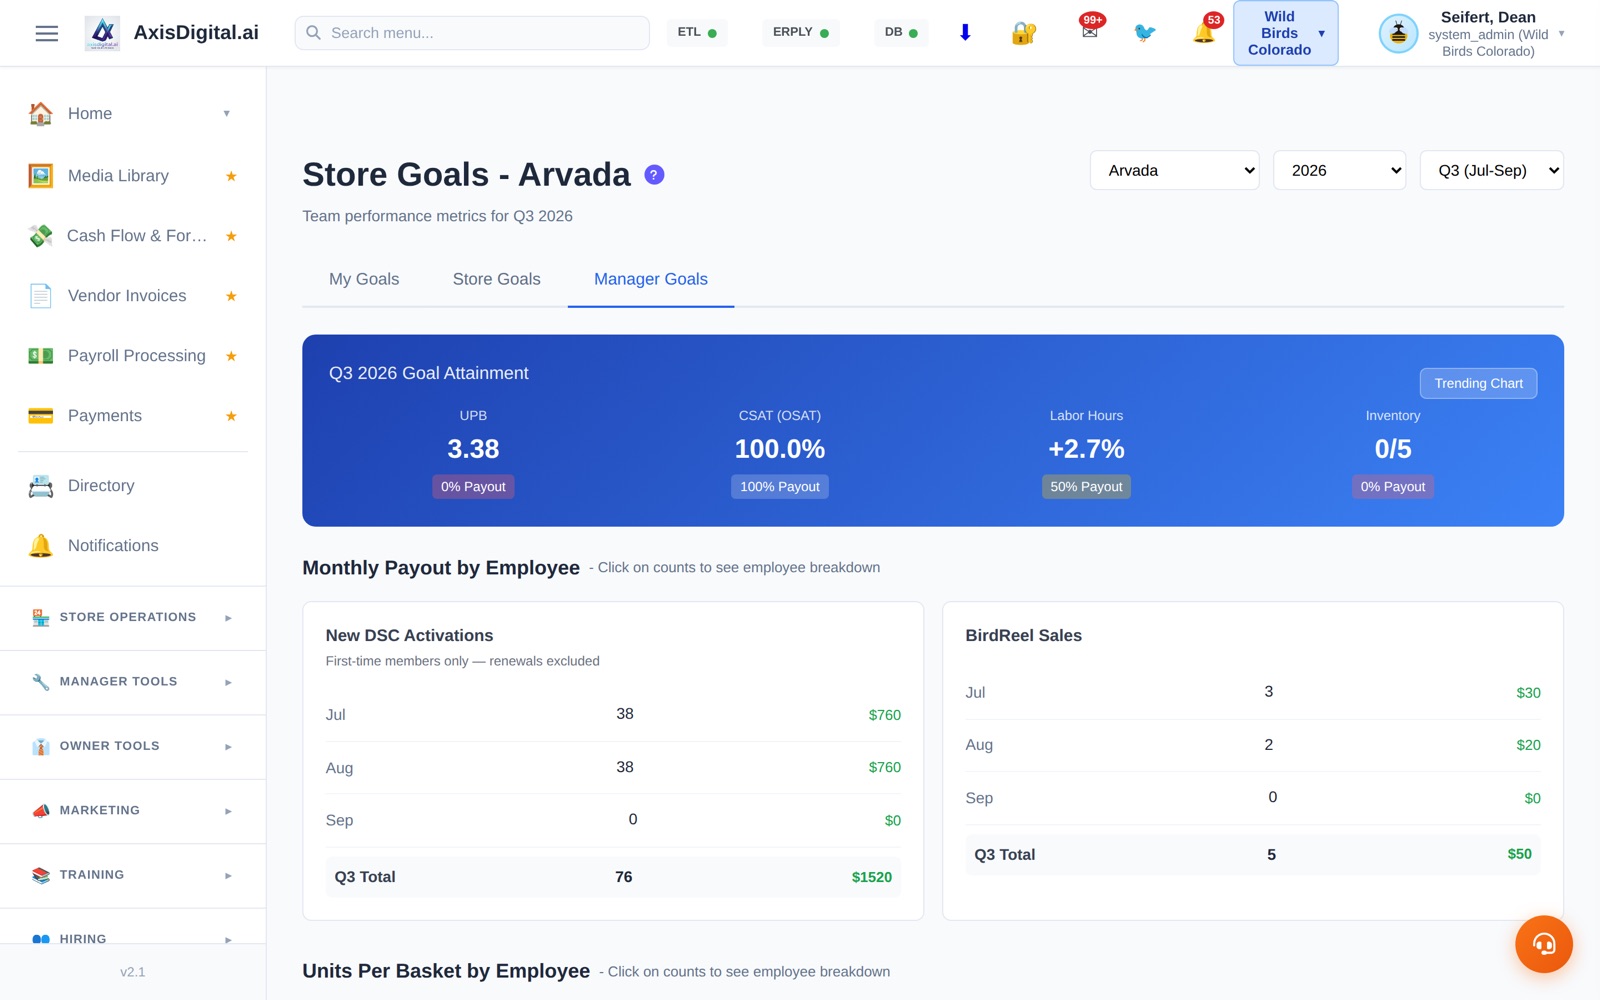
Publishing a scenario turns its targets into a live store scoreboard. Quarterly attainment is computed from register and survey data automatically: units per basket, customer satisfaction, labor hours, inventory checks — each with the payout percentage it has earned.

A real quarter mid-flight: UPB 3.38, CSAT 100% (full payout), labor +2.7% (half payout). Nobody compiles this — it compiles itself.

  • Attainment straight from POS + survey data — no manual tallies
  • Per-metric payout percentages, visible all quarter
  • Trending chart shows trajectory, not just the score
Attainment tracks itself — and prices the payout.
Live Q3 attainment with payout percentages — and $1,520 of DSC bonuses earned by the team.
Every employee sees their own

Goals people can see get hit.

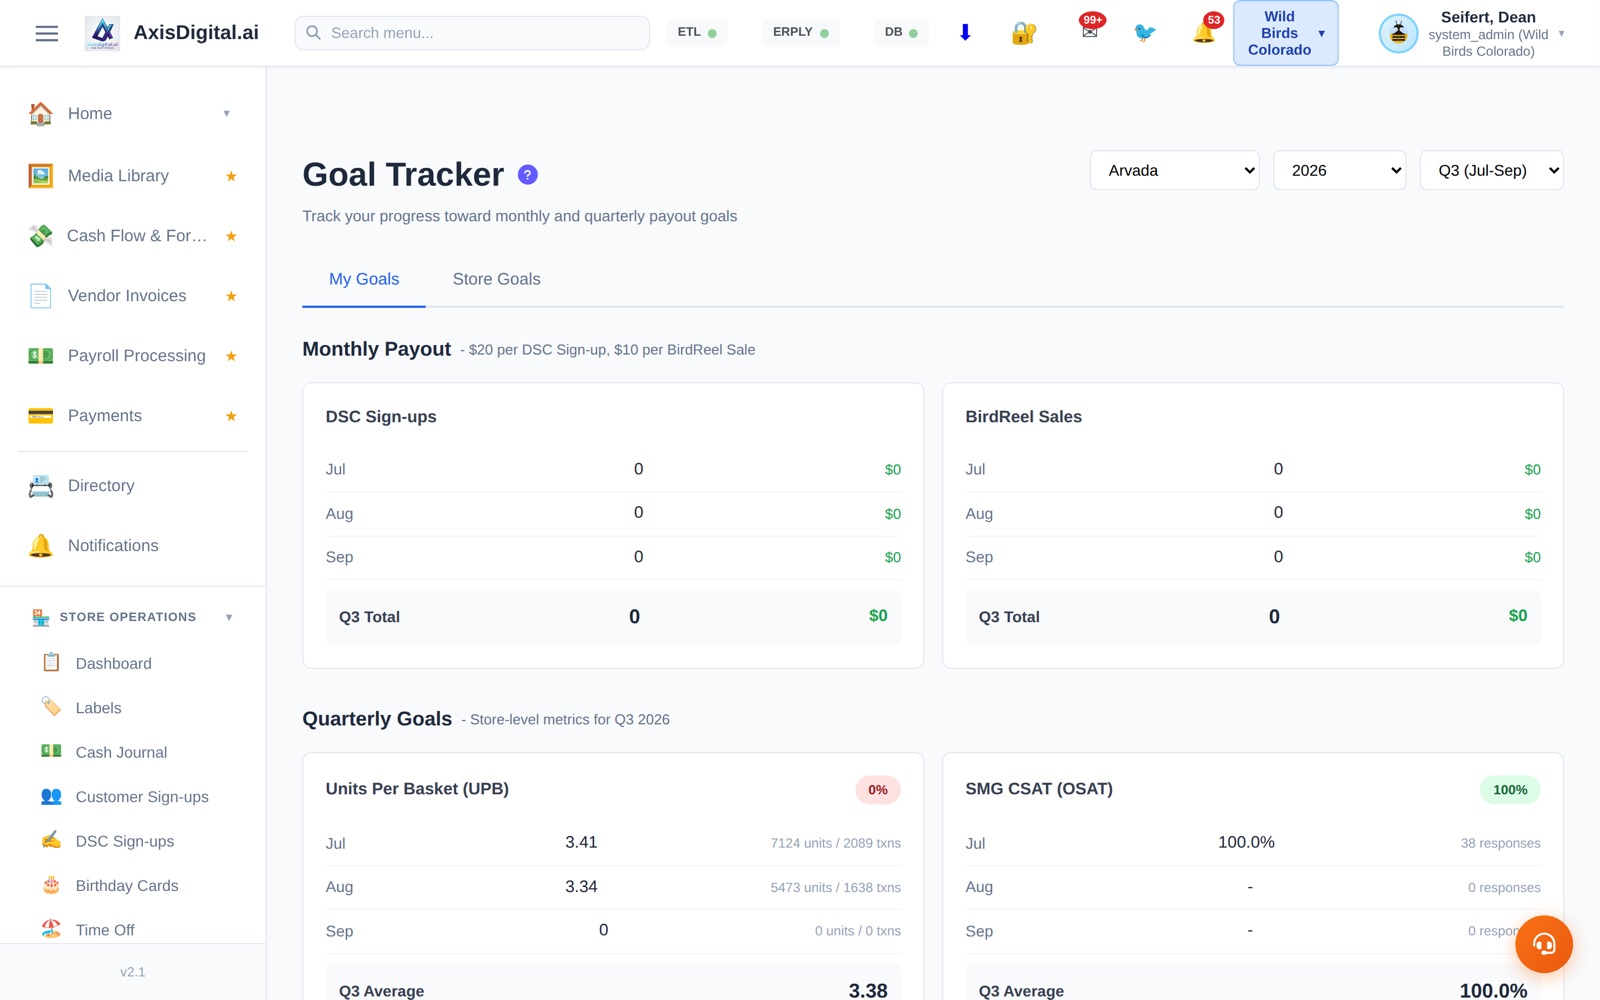
Each employee gets a personal goal page: their monthly payout counters ($20 per DSC sign-up, $10 per BirdReel sale in this store's program) and the store's quarterly metrics they contribute to.

The bonus math is public, current, and per person — which is exactly what makes an incentive program actually move behavior instead of surprising people at quarter end.

  • Personal payout tracking, month by month
  • Store quarterly metrics visible to the whole team
  • Same page on desktop and the mobile app
Goals people can see get hit.
An employee's own view: payout counters up top, store quarterly metrics below.
The forecast rides along

Plan vs. actual, in your pocket.

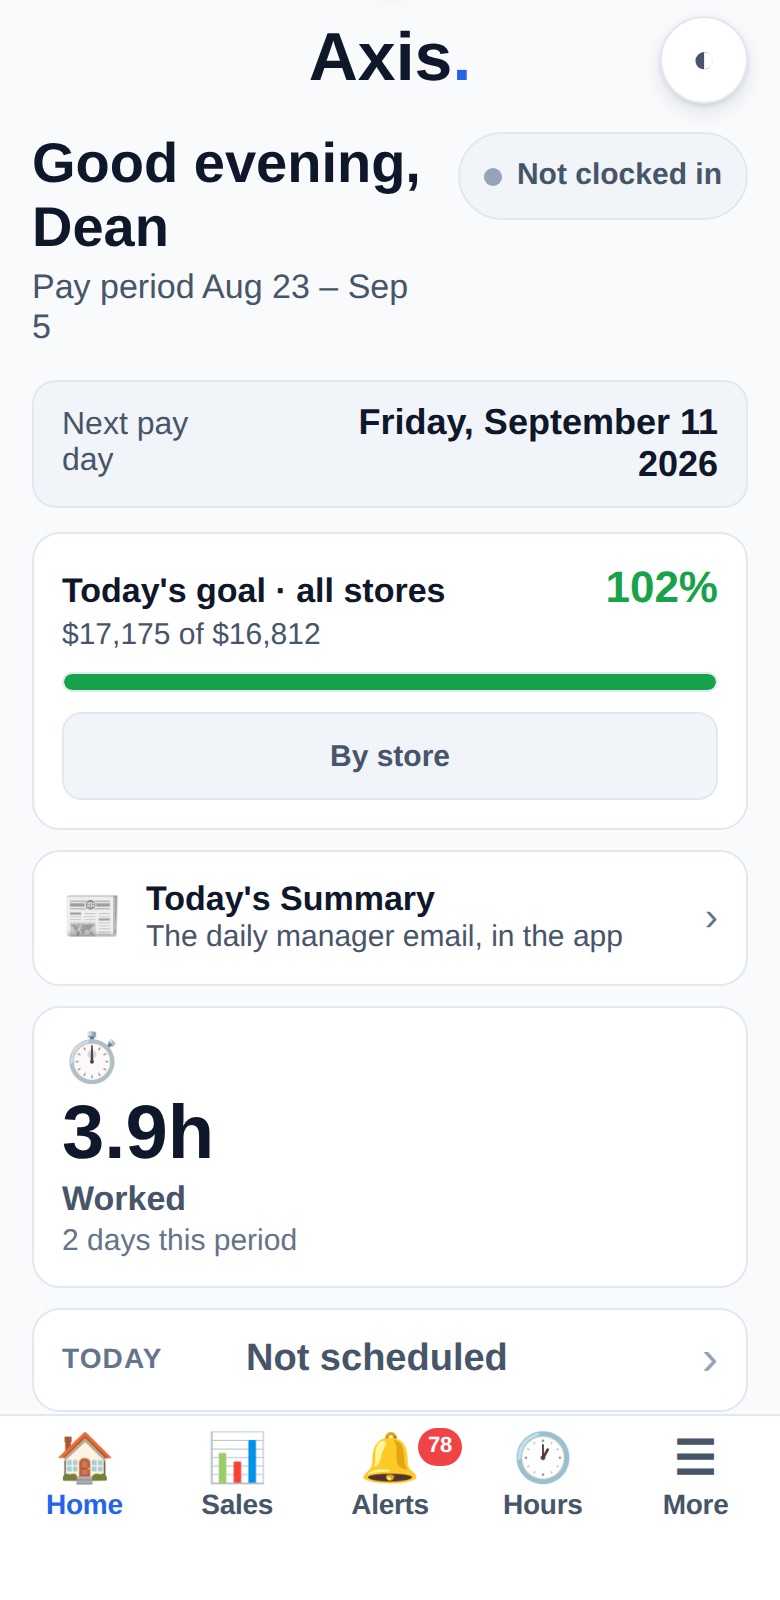
The published plan feeds the fiscal-year forecast that managers and owners watch daily — including on the Axis mobile app, where the FY forecast sits one tap away next to today's sales.

Plan, publish, then watch the year land against it from anywhere.

  • FY forecast tile on the mobile dashboard
  • Same numbers on desktop, TV dashboards, and phone
  • Variance visible daily — not at month close
Plan vs. actual, in your pocket.
Today against the published goal, on the phone — every store, one tap away.
✓ Included with Platform

Included with the Axis Platform.

Included with every Axis subscription at $299/store/month. Multi-store? Save up to 50% — see multi-store pricing. Unlimited users, concierge onboarding.

See it in action →

Stop planning in a spreadsheet nobody opens.

See a scenario built, published, and tracking live in one demo.

📅 Book a Demo →

Book a Demo

See the Analytics Dashboards in action — 30 minute walkthrough

March 2026

📅
Plan
Date
Time
Duration30 minutes
✓

You're All Set!

Your demo is booked for

We'll send a calendar invite and Zoom link to

Get in Touch

Have a question about Analytics & Performance? We'll get back to you within one business day.